Chapter 2 01-NYPD
2.1 Chapter introduction
In this report, I build on my Week 3 homework by looking at the NYC shooting dataset. I explore patterns in shootings by time of day and borough, clean up the data, and then use plots to highlight some key trends.
2.2
I pulled the latest 30,000 NYPD shooting incidents from NYC Open Data’s API and put them into R as a data frame for analysis.
2.3
I got rid of missing rows, when race was not there, and I made boroughs and race lower case.
2.4
I counted shootings per borough to compare the amount of shootings in each borough. The borough with the most shootings is brooklyn with 7404 incidents.
2.5
ggplot(shooting_data, aes(x = time_of_day, fill = time_of_day)) +
  geom_bar() +
  labs(title = "Shootings by Time of Day",
       x = "Time of Day",
       y = "Number of Shootings") +
  theme_minimal(base_size = 14) +
  scale_fill_brewer(palette = "Set2")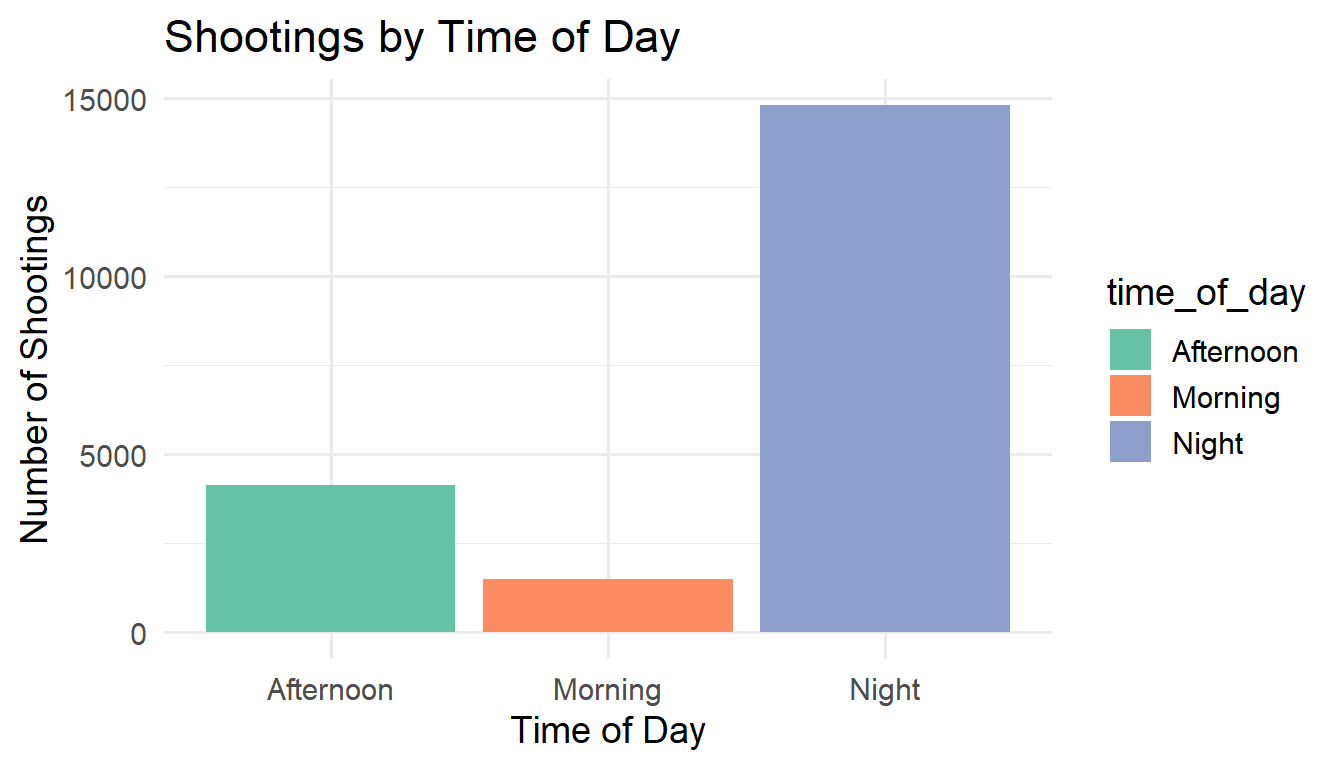
Figure 2.1: Number of NYPD shooting incidents (most recent 30,000 records pulled via NYC Open Data API) grouped by time of day. This shows when shootings are most likely to occur across the day.
2.6
ggplot(shooting_data, aes(x = boro, fill = boro)) +
  geom_bar() +
  facet_wrap(~time_of_day) +
  labs(title = "Shootings by Borough and Time of Day",
       x = "Borough",
       y = "Number of Shootings") +
  theme_minimal(base_size = 14) +
  scale_fill_brewer(palette = "Set3")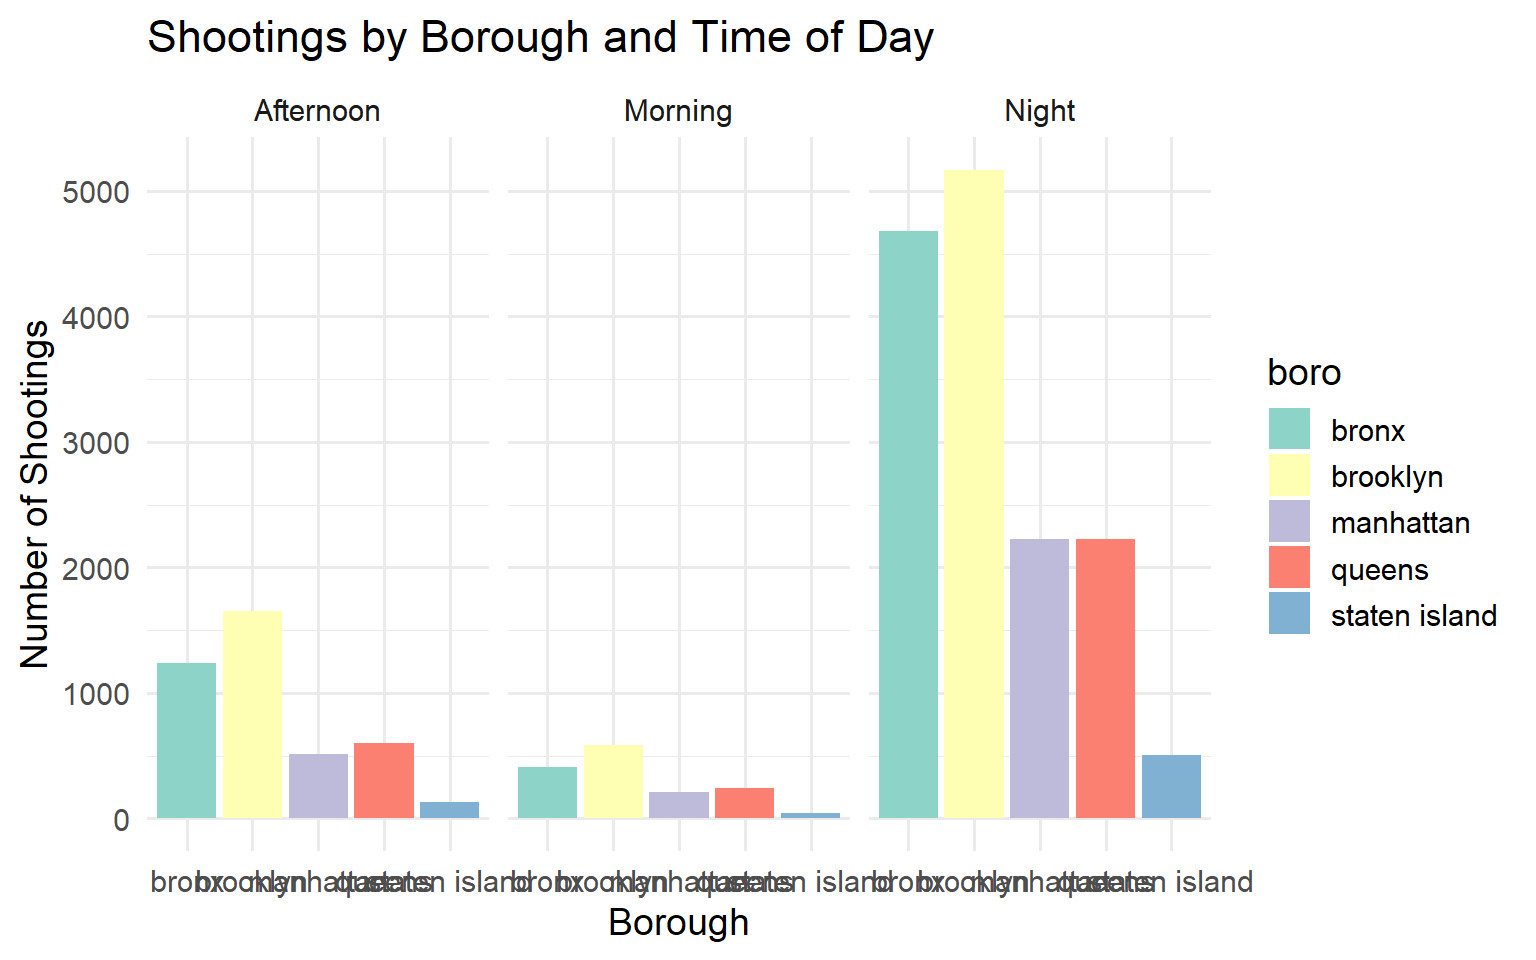
Figure 2.2: NYPD shooting incidents by borough, faceted by time of day (most recent 30,000 records). Comparing panels highlights how the borough distribution changes across morning, afternoon, and night.
2.7
boro_counts %>%
  arrange(desc(n)) %>%
  kable(
    caption = "Count of NYPD shooting incidents by borough (most recent 30,000 records pulled from NYC Open Data)."
  ) %>%
kable_styling(full_width = FALSE)| boro | n |
|---|---|
| brooklyn | 7404 |
| bronx | 6328 |
| queens | 3069 |
| manhattan | 2953 |
| staten island | 680 |
2.8
I copied my codes from homework 3, where I analyzed the time of day that shootings were occuring, and then I plotted it. I then also plotted the amount of shootings by borough. I made a table of the borough counts. NYC Open Data Shooting Incident Dataset This workflow makes it way easier to grab and clean big datasets. In my research I have to keep track of large datasets and I have to make sure my mentor understands what steps I am taking to clean the data we collect. The visualization helps me see the results in a clear way. My research is analzying people who believe in the Bad Apples Theory, and how that correlates with those who cause harm.