Chapter 8 07-Wage Predictors
8.1 Intro
Today our analysis will help to determine whether demographic, age, marital status, employment, and health characteristics can be used to predict whether someone earns a (comparably) higher or lower wage. Creating a binary wage outcome based on the median wage with these different variables, conducting classical statistical tests (t-tests, ANOVA, and chi-square), and building a logistic regression model will help us draw conclusions on what factors can predict one’s income.
8.2
## 'data.frame':    3000 obs. of  11 variables:
##  $ year      : int  2006 2004 2003 2003 2005 2008 2009 2008 2006 2004 ...
##  $ age       : int  18 24 45 43 50 54 44 30 41 52 ...
##  $ maritl    : Factor w/ 5 levels "1. Never Married",..: 1 1 2 2 4 2 2 1 1 2 ...
##  $ race      : Factor w/ 4 levels "1. White","2. Black",..: 1 1 1 3 1 1 4 3 2 1 ...
##  $ education : Factor w/ 5 levels "1. < HS Grad",..: 1 4 3 4 2 4 3 3 3 2 ...
##  $ region    : Factor w/ 9 levels "1. New England",..: 2 2 2 2 2 2 2 2 2 2 ...
##  $ jobclass  : Factor w/ 2 levels "1. Industrial",..: 1 2 1 2 2 2 1 2 2 2 ...
##  $ health    : Factor w/ 2 levels "1. <=Good","2. >=Very Good": 1 2 1 2 1 2 2 1 2 2 ...
##  $ health_ins: Factor w/ 2 levels "1. Yes","2. No": 2 2 1 1 1 1 1 1 1 1 ...
##  $ logwage   : num  4.32 4.26 4.88 5.04 4.32 ...
## $ wage : num 75 70.5 131 154.7 75 ...## [1] 104.9215Wage <- Wage %>%
mutate(
WageCategory = case_when(
wage > wage_median ~ "High",
wage < wage_median ~ "Low",
TRUE ~ NA_character_ # rows exactly equal to median
)
)
Wage <- Wage %>% filter(!is.na(WageCategory))
Wage$WageCategory <- factor(Wage$WageCategory, levels = c("Low", "High"))
knitr::kable(table(Wage$WageCategory),
caption = "Number of observations classified as low versus high wage earners.")| Var1 | Freq |
|---|---|
| Low | 1447 |
| High | 1483 |
clean_factor <- function(x) {
  x <- as.character(x)
  x <- str_replace(x, "^[0-9]+\\.\\s*", "")
  factor(x)
}

Wage <- Wage %>%
  mutate(
    race       = clean_factor(race),
    education  = clean_factor(education),
    jobclass   = clean_factor(jobclass),
    health     = clean_factor(health),
    health_ins = clean_factor(health_ins),
    maritl     = clean_factor(maritl)
  )

summary(Wage[, c("race", "education", "jobclass", "health", "health_ins", "maritl")])
## race education jobclass health
## Asian: 187 < HS Grad :264 Industrial :1507 <=Good : 841
## Black: 280 Advanced Degree:423 Information:1423 >=Very Good:2089
## Other: 36 College Grad :661
## White:2427 HS Grad :949
## Some College :633
## health_ins maritl
## No : 901 Divorced : 200
## Yes:2029 Married :2019
## Never Married: 639
## Separated : 55
## Widowed : 178.3
Wage %>%
  group_by(WageCategory) %>%
  summarise(
    mean_age = mean(age, na.rm = TRUE),
    sd_age   = sd(age, na.rm = TRUE),
    n        = n()
  ) %>%
  knitr::kable(
    caption = "Mean age and standard deviation by wage category."
)| WageCategory | mean_age | sd_age | n |
|---|---|---|---|
| Low | 40.01106 | 12.669373 | 1447 |
| High | 44.68510 | 9.820245 | 1483 |
##
##  Welch Two Sample t-test
##
## data:  age by WageCategory
## t = -11.143, df = 2724.7, p-value < 2.2e-16
## alternative hypothesis: true difference in means between group Low and group High is not equal to 0
## 95 percent confidence interval:
##  -5.496555 -3.851525
## sample estimates:
##  mean in group Low mean in group High
##           40.01106           44.68510
A Welch two-sample t-test compared the mean age of “high” vs. “low” income levels. *Results showed a significant difference, t(2724.7) = −11.14, p < .001.
Mean age (Low): 40.01 years
Mean age (High): 44.69 years
Mean difference: ≈ 4.7 years
8.4
Interpretation
We can interpret these findings as higher income earners are on average older than lower income earners. Age is positively associated with income.
##               Df  Sum Sq Mean Sq F value Pr(>F)
## education      4 1242703  310676   228.5 <2e-16 ***
## Residuals   2925 3976086    1359
## ---
## Signif. codes:  0 '***' 0.001 '**' 0.01 '*' 0.05 '.' 0.1 ' ' 1
An ANOVA tested whether income differs by education level:
F(4, 2925) = 228.5, p < .001
We can interpret these findings as a strong effect on education, meaning the highest wages made the most money, compared to lowest incomes(across the five income brackets). As education level went up, so did income/ wage level.
8.5
wage_maritl_table <- table(Wage$WageCategory, Wage$maritl)
knitr::kable(
  wage_maritl_table,
  caption = "Contingency table of wage category by marital status."
)| Divorced | Married | Never Married | Separated | Widowed | |
|---|---|---|---|---|---|
| Low | 114 | 817 | 470 | 37 | 9 |
| High | 86 | 1202 | 169 | 18 | 8 |
##
##  Pearson's Chi-squared test
##
## data:  wage_maritl_table
## X-squared = 225.33, df = 4, p-value < 2.2e-16##
## Divorced Married Never Married Separated Widowed
## Low 98.77133 997.0966 315.5744 27.16212 8.395563
## High 101.22867 1021.9034 323.4256 27.83788 8.604437## [1] 0.2773195A chi-square test evaluated whether wage category is associated with marital status:
χ²(4) = 225.33, p < .001
Cramer’s V = 0.277
We can interpret the chi-square test with a moderate association between marital status and wage category. However, married participants are over-represented in the high wage group and un-married individuals are over-represented in the low wage group, which can skew the data inaccurately.
set.seed(123)
split_flag <- sample.split(Wage$WageCategory, SplitRatio = 0.7)

train_data <- subset(Wage, split_flag == TRUE)
test_data  <- subset(Wage, split_flag == FALSE)

nrow(train_data); nrow(test_data)
## [1] 2051## [1] 8798.6
logit_model <- glm(
  WageCategory ~ age + education + jobclass + maritl + health + health_ins,
  data = train_data,
  family = binomial
)

summary(logit_model)
##
## Call:
## glm(formula = WageCategory ~ age + education + jobclass + maritl +
## health + health_ins, family = binomial, data = train_data)
##
## Coefficients:
## Estimate Std. Error z value Pr(>|z|)
## (Intercept) -3.906039 0.410689 -9.511 < 2e-16 ***
## age 0.016967 0.005301 3.201 0.00137 **
## educationAdvanced Degree 2.878189 0.272729 10.553 < 2e-16 ***
## educationCollege Grad 2.356742 0.243963 9.660 < 2e-16 ***
## educationHS Grad 0.654597 0.231391 2.829 0.00467 **
## educationSome College 1.399887 0.238876 5.860 4.62e-09 ***
## jobclassInformation 0.128700 0.110463 1.165 0.24398
## maritlMarried 0.816820 0.209849 3.892 9.92e-05 ***
## maritlNever Married -0.480261 0.245800 -1.954 0.05072 .
## maritlSeparated -0.213755 0.474737 -0.450 0.65252
## maritlWidowed 0.191127 0.599294 0.319 0.74979
## health>=Very Good 0.325054 0.121269 2.680 0.00735 **
## health_insYes 1.372473 0.123232 11.137 < 2e-16 ***
## ---
## Signif. codes: 0 '***' 0.001 '**' 0.01 '*' 0.05 '.' 0.1 ' ' 1
##
## (Dispersion parameter for binomial family taken to be 1)
##
## Null deviance: 2843.0 on 2050 degrees of freedom
## Residual deviance: 2115.4 on 2038 degrees of freedom
## AIC: 2141.4
##
## Number of Fisher Scoring iterations: 4## (Intercept) age educationAdvanced Degree
## 0.02012005 1.01711169 17.78204218
## educationCollege Grad educationHS Grad educationSome College
## 10.55650582 1.92436665 4.05474320
## jobclassInformation maritlMarried maritlNever Married
## 1.13734877 2.26329134 0.61862205
## maritlSeparated maritlWidowed health>=Very Good
## 0.80754605 1.21061266 1.38410575
## health_insYes
## 3.94509346## Waiting for profiling to be done...## 2.5 % 97.5 %
## (Intercept) 0.008880154 0.04447506
## age 1.006623973 1.02776935
## educationAdvanced Degree 10.544345226 30.76750089
## educationCollege Grad 6.618263517 17.25899258
## educationHS Grad 1.236224160 3.07016179
## educationSome College 2.566408373 6.56196069
## jobclassInformation 0.915418699 1.41171317
## maritlMarried 1.503694264 3.42685266
## maritlNever Married 0.382337937 1.00301632
## maritlSeparated 0.305655850 1.99075661
## maritlWidowed 0.368417266 3.95933760
## health>=Very Good 1.091532922 1.75622946
## health_insYes 3.104800954 5.03437155test_probs <- predict(logit_model, newdata = test_data, type = "response")
test_pred_class <- ifelse(test_probs > 0.5, "High", "Low")
test_pred_class <- factor(test_pred_class, levels = c("Low", "High"))
conf_mat <- confusionMatrix(
data = test_pred_class,
reference = test_data$WageCategory,
positive = "High"
)
conf_mat## Confusion Matrix and Statistics
##
## Reference
## Prediction Low High
## Low 304 119
## High 130 326
##
## Accuracy : 0.7167
## 95% CI : (0.6857, 0.7463)
## No Information Rate : 0.5063
## P-Value [Acc > NIR] : <2e-16
##
## Kappa : 0.4332
##
## Mcnemar's Test P-Value : 0.5263
##
## Sensitivity : 0.7326
## Specificity : 0.7005
## Pos Pred Value : 0.7149
## Neg Pred Value : 0.7187
## Prevalence : 0.5063
## Detection Rate : 0.3709
## Detection Prevalence : 0.5188
## Balanced Accuracy : 0.7165
##
## 'Positive' Class : High
## 8.7
Model classification performance on the test set
roc_obj <- roc(response = test_data$WageCategory,
               predictor = test_probs,
               levels = c("Low", "High"))  # "High" is the event
## Setting direction: controls < cases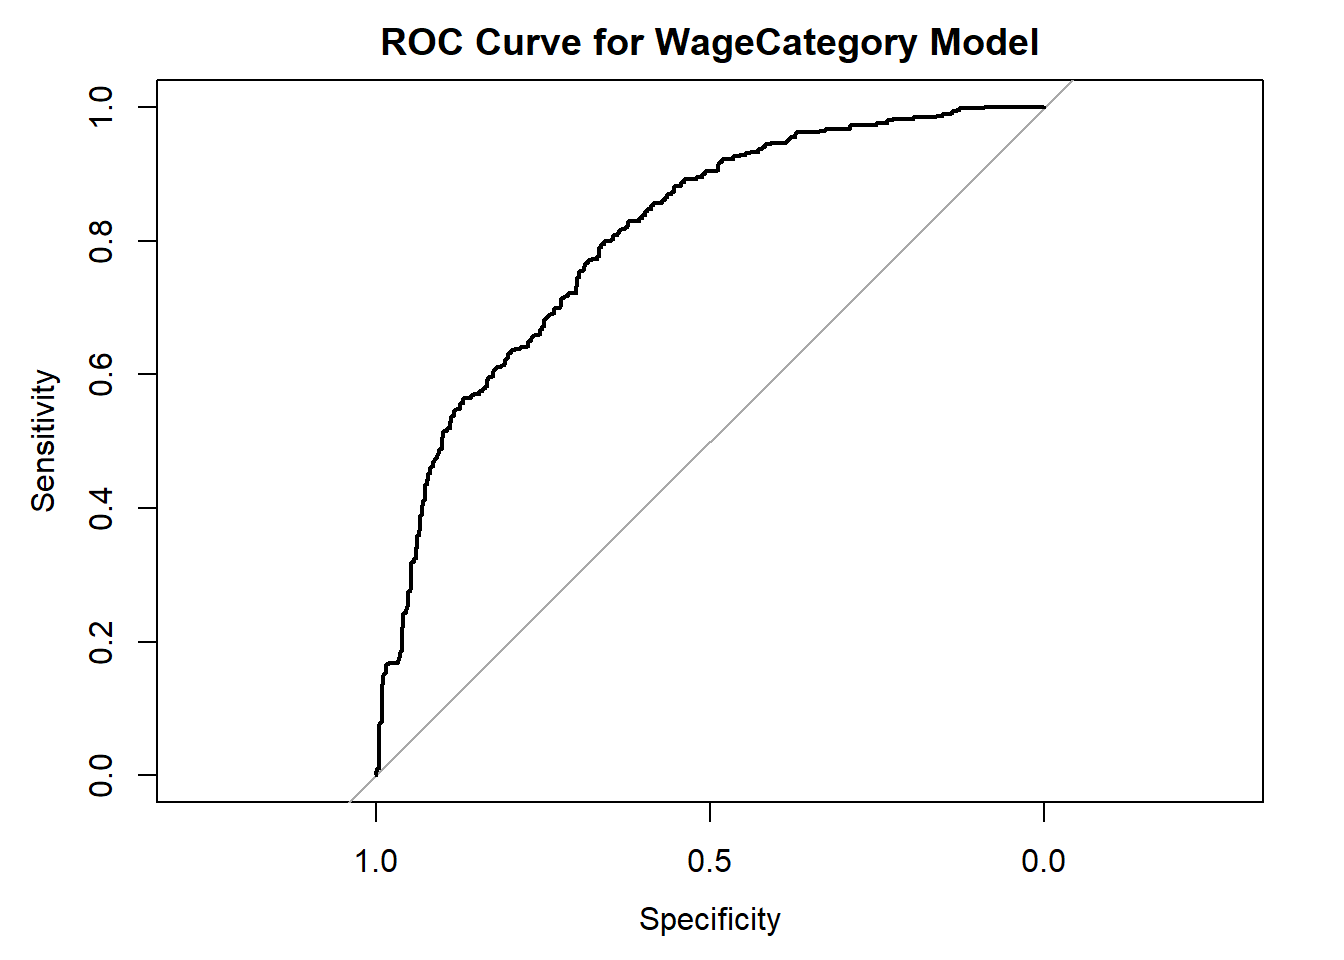
Figure 7.2: high versus low wage earners
## Area under the curve: 0.80638.8
Our analysis shows that high earners were older on average, and education had one of the strongest effects. Incomes increased with each higher level of education. Married workers seemed more likely to be high earners and never-married workers seemed more likely to fall into the low-wage group, but the representations was not equally distributed.The logistic regression also confirmed these patterns. Education was the biggest predictor, with people with advanced degrees having higher odds of being high earners. Age, being married, better health, and having health insurance also increased the likelihood of earning a higher wage, while job class didn’t add much once other factors were included.
The model performed well on new data, with an accuracy of about 71.7%, which is much better than guessing. If we were to continue this analysis, it would be interesting to adjust some variables and explore additional factors like childhood family income, parental involvement, family structure, or early life stability(such as parental divorce, death in family, etc). These kinds of variables might help explain how early experiences shape income later in adulthood. Overall, this project highlights the characteristics most connected to current wage levels and points toward meaningful directions for future research on how upbringing might influence economic outcomes.